VWAP Fibonacci Bands (Zeiierman)█ Overview
The VWAP Fibonacci Bands is a sophisticated yet user-friendly indicator designed to assist traders in visualizing market trends, volatility, and potential support/resistance levels. Developed by Zeiierman, this tool integrates the MIDAS (Market Interpretation Data Analysis System) methodology with Standard Deviation Bands and user-defined Fibonacci levels to provide a comprehensive market analysis framework.
This indicator is built for traders who want a dynamic and customizable approach to understanding market movements, offering features that adapt to varying market conditions. Whether you're a scalper, swing trader, or long-term investor.
█ How It Works
⚪ Anchor Point System
The indicator begins its calculations based on an anchor point, which can be set to:
A specific date for historical analysis or alignment with significant market events.
A timeframe-based reset, dynamically restarting calculations at the beginning of each selected period (e.g., daily, weekly, or monthly).
This dual-anchor method ensures flexibility, allowing the indicator to align with various trading strategies.
⚪ MIDAS Calculation
The MIDAS calculation is central to this indicator. It uses cumulative price and volume data to compute a volume-weighted average price (VWAP), offering a trendline that reflects the true value weighted by trading activity.
⚪ Standard Deviation Bands
The upper and lower bands are calculated using the standard deviation of price movements around the MIDAS line.
⚪ Fibonacci Levels
User-defined Fibonacci ratios are used to plot additional support and resistance levels between the bands. These levels provide visual cues for potential price reversals or trend continuations.
█ How to Use
⚪ Trend Identification
Uptrend: The price remains above the MIDAS line.
Downtrend: The price stays below the MIDAS line and aligns with the lower bands.
⚪ Support and Resistance
The upper and lower bands act as support and resistance levels.
Fibonacci levels provide intermediate zones for potential price reversals.
⚪ Volatility Analysis
Wider bands indicate periods of high volatility.
Narrower bands suggest low-volatility conditions, often preceding breakouts.
⚪ Overbought/Oversold Conditions
Look for the price beyond the upper or lower bands to identify extreme conditions.
█ Settings
Set Anchor Method
Anchor Method: Choose between Timeframe or Date to define the starting point of calculations.
Anchor Timeframe: For Timeframe mode, specify the interval (e.g., Daily, Weekly).
Anchor Date: For Date mode, set the exact starting date for historical alignment.
Set Std Dev Multiplier
Controls the width of the bands:
Higher values widen the bands, filtering out minor fluctuations.
Lower values tighten the bands for more responsive analysis.
Set Fibonacci Levels
Define custom Fibonacci ratios (e.g., 0.236, 0.382) to plot intermediate levels between the bands.
█ Tips for Fine-Tuning
⚪ For Trend Trading:
Use higher Std Dev Multipliers to focus on long-term trends and avoid noise. Adjust Anchor Timeframe to Weekly or Monthly for broader trend analysis.
⚪ For Reversal Trading:
Tighten the bands with a lower Std Dev Multiplier.
Use shorter anchor timeframes for intraday reversals (e.g., Hourly).
⚪ For Volatile Markets:
Increase the Std Dev Multiplier to accommodate wider price swings.
⚪ For Quiet Markets:
Decrease the Std Dev Multiplier to highlight smaller fluctuations.
-----------------
Disclaimer
The information contained in my Scripts/Indicators/Ideas/Algos/Systems does not constitute financial advice or a solicitation to buy or sell any securities of any type. I will not accept liability for any loss or damage, including without limitation any loss of profit, which may arise directly or indirectly from the use of or reliance on such information.
All investments involve risk, and the past performance of a security, industry, sector, market, financial product, trading strategy, backtest, or individual's trading does not guarantee future results or returns. Investors are fully responsible for any investment decisions they make. Such decisions should be based solely on an evaluation of their financial circumstances, investment objectives, risk tolerance, and liquidity needs.
My Scripts/Indicators/Ideas/Algos/Systems are only for educational purposes!
Поиск скриптов по запросу "support resistance"

Fibonacci Trend [ChartPrime]Fibonacci Trend Indicator
This powerful indicator leverages supertrend analysis to detect market direction while overlaying dynamic Fibonacci levels to highlight potential support, resistance, and optimal trend entry zones. With its straightforward design, it is perfect for traders looking to simplify their workflow and enhance decision-making.
⯁ KEY FEATURES AND HOW TO USE
⯌ Supertrend Trend Identification :
The indicator uses a supertrend algorithm to identify market direction. It displays purple for downtrends and green for uptrends, ensuring quick and clear trend analysis.
⯌ Fibonacci Levels for Current Swings :
Automatically calculates Fibonacci retracement levels (0.236, 0.382, 0.618, 0.786) for the current swing leg.
- These levels act as key zones for potential support, resistance, and trend continuation.
- The high and low swing points are labeled with exact prices, ensuring clarity.
- If the swing range is insufficient (less than five times ATR), Fibonacci levels are not displayed, avoiding irrelevant data.
⯌ Extended Fibonacci Levels :
User-defined extensions project Fibonacci levels into the future, aiding traders in planning price targets or projecting key zones.
⯌ Optimal Trend Entry Zone :
A filled area between 0.618 and 0.786 levels visually highlights the optimal entry zone for trend continuation. This allows traders to refine their entry points during pullbacks.
⯌ Diagonal Trend Line :
A dashed diagonal line connects the swing high and low, visually confirming the range and trend strength of the current swing.
⯌ Visual Labels for Fibonacci Levels :
Each Fibonacci level is marked with a label displaying its value for quick reference.
⯁ HOW TRADERS CAN POTENTIALLY USE THIS TOOL
Fibonacci Retracements:
Use the Fibonacci retracement levels to find key support or resistance zones where the price may pull back before continuing its trend.
Example: Enter long trades when the price retraces to 0.618–0.786 levels in an uptrend.
Fibonacci Extensions:
Use Fibonacci extensions to project future price targets based on the current trend's swing leg. Levels like 127.2% and 161.8% are commonly used as profit-taking zones.
Reversal Identification:
Spot potential reversals by monitoring price reactions at key Fibonacci retracement levels (e.g., 0.236 or 0.382) or the swing high/low.
Optimal Trend Entries:
The filled zone between 0.618 and 0.786 is a statistically strong area for entering a position in the direction of the trend.
Example: Enter long positions during retracements to this range in an uptrend.
Risk Management:
Set stop-losses below key Fibonacci levels or the swing low/high, and take profits at extension levels, enhancing your trade management strategies.
⯁ CONCLUSION
The Fibonacci Trend Indicator is a straightforward yet effective tool for identifying trends and key Fibonacci levels. It simplifies analysis by integrating supertrend-based trend identification with Fibonacci retracements, extensions, and optimal entry zones. Whether you're a beginner or experienced trader, this indicator is an essential addition to your toolkit for trend trading, reversal spotting, and risk management.

OCM Quarter Point Autopilot - A Multi-Timeframe Quarter TheoryDescription:
The OCM Quarter Point Autopilot indicator automates the application of Quarters Theory across multiple timeframes and instruments. It creates a comprehensive grid of support and resistance levels based on two user-defined price points (Monthly QTPs).
Key Features:
- Automatically calculates and displays quarter points across 5 timeframes:
• Monthly (Black lines)
• Weekly (Blue lines)
• Daily (Green lines)
• 4-Hour (Red lines)
• 1-Hour (Purple lines)
- Shows both upper and lower ranges, which can be toggled on/off
- Visual hierarchy through color-coding for easy timeframe identification
- Extends lines 2 years into the past and 6 months into the future
Usage:
1. Enter two Monthly Quarter Trading Points (QTPs)
2. The indicator automatically:
- Calculates midpoints (weekly)
- Quarter points (daily)
- Eighth points (4-hour)
- Further subdivisions (1-hour)
Benefits:
- Identifies potential support/resistance levels
- Helps spot key price targets
- Works on any instrument where psychological levels matter
- Provides multiple timeframe analysis in one view
Best suited for traders who:
- Follow multi-timeframe analysis
- Trade using support/resistance levels
- Want to identify potential price targets
- Need structured price levels for entries/exits
The indicator combines the systematic approach of Quarters Theory with automated calculation and visualization, making it easier to identify key price levels across multiple timeframes.

Fractal levels Gold [AstroHub]This indicator detects key fractal points on a price chart and visually marks them with shapes and levels. It helps traders identify potential reversal zones and dynamic support/resistance levels, enhancing market analysis.
Key Features:
Fractal Detection:
The indicator identifies top and bottom fractals using a 5-bar pattern.
A top fractal forms when the middle bar has a higher high compared to the two bars on either side.
A bottom fractal forms when the middle bar has a lower low compared to the two bars on either side.
Fractal Filtering:
The indicator can filter out "pristine" fractals (uninterrupted fractal patterns) based on custom conditions, making it more selective and reducing false signals.
Fractal Plotting:
are plotted as downward triangles.
are plotted as upward triangles.
Users can choose to display or hide fractal points and their corresponding labels.
Fractal Levels:
The indicator automatically plots fractals' levels on the chart, marking potential resistance and support zones.
Fractal levels change dynamically as new fractals are identified.
Customizable Display Options:
Show or hide fractals and levels with adjustable settings.
Choose whether to apply filtering for pristine fractals.
Display the pivot labels to easily track fractal positions.
How It Works:
The indicator uses a simple approach to recognize top and bottom fractals . When a valid fractal is detected, it highlights it on the chart and plots the corresponding price level.
By default, top fractals are shown above the bars (red color), and bottom fractals are shown below the bars (green color).
Fractal levels represent potential reversal points and can act as dynamic support and resistance zones.
Best Use:
The indicator is particularly useful in identifying reversal points and trend changes, helping traders to spot key price levels.
It can be used across various timeframes and markets, particularly for trend-following or reversal strategies.
Customizable Settings:
Show Pivots: Toggle the display of pivot points.
Show Pivot Labels: Display labels for pivot levels.
Show Fractals: Toggle fractal points on the chart.
Show Fractal Levels: Show or hide the levels corresponding to the detected fractals.
Filter for Pristine Fractals: Enable this option to filter out non-pristine fractals for higher accuracy.
Conclusion:
This indicator provides clear, actionable fractal signals, helping traders easily identify critical levels for entry and exit. With customizable settings and visual cues, it's suitable for both novice and expe

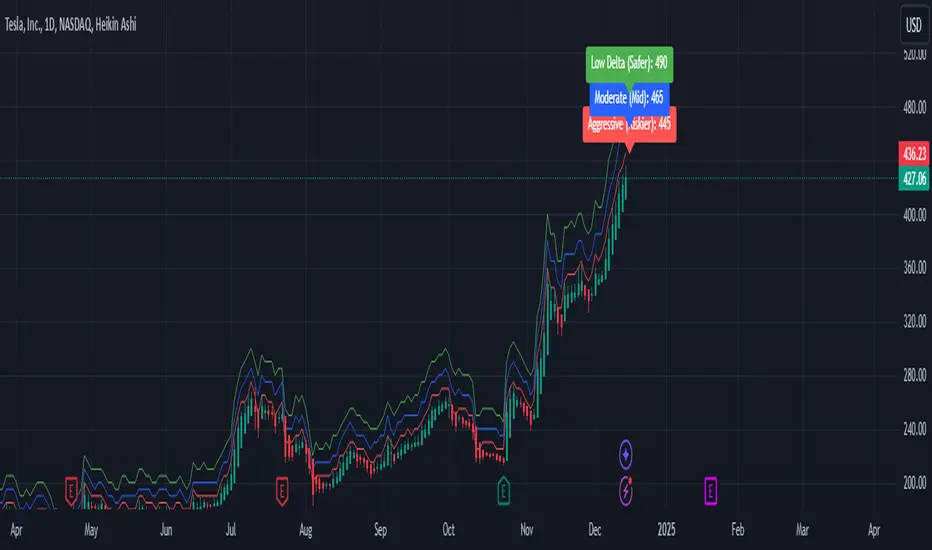
Weekly Covered Calls Strategy with IV & Delta LogicWhat Does the Indicator Do?
this is interactive you must use it with your options chain to input data based on the contract you want to trade.
Visualize three strike price levels for covered calls based on:
Aggressive (closest to price, riskier).
Moderate (mid-range, balanced).
Low Delta (farthest, safer).
Incorporate Implied Volatility (IV) from the options chain to make strike predictions more realistic and aligned with market sentiment. Adjust the risk tolerance by modifying Delta inputs and IV values. Risk is defined for example .30 delta means 30% chance of your shares being assigned. If you want to generate steady income with your shares you might want to lower the risk of them being assigned to .05 or 5% etc.
How to Use the Indicator with the Options Chain
Start with the Options Chain:
Look for the following data points from your options chain:
Implied Volatility (IV Mid): Average IV for a particular strike price.
Delta:
~0.30 Delta: Closest strike (Aggressive).
~0.15–0.20 Delta: Mid-range strike (Moderate).
~0.05–0.10 Delta: Far OTM, safer (Low Delta).
Strike Price: Identify strike prices for the desired Deltas.
Open Interest: Check liquidity; higher OI ensures tighter spreads.
Input IV into the Indicator:
Enter the IV Mid value (e.g., 0.70 for 70%) from the options chain into the Implied Volatility field of the indicator.
Adjust Delta Inputs Based on Risk Tolerance:
Aggressive Delta: Increase if you want strikes closer to the current price (riskier, higher premium).
Default: 0.2 (20% chance of shares being assigned).
Moderate Delta: Balanced risk/reward.
Default: 0.12 (12%)
Low Delta: Decrease for safer, farther OTM strikes.
Default: 0.05 (5%)
Visualize the Chart:
Once inputs are updated:
Red Line: Aggressive Strike (closest, riskiest, higher premium).
Blue Line: Moderate Strike (mid-range).
Green Line: Low Delta Strike (farthest, safer).
Step-by-Step Workflow Example
Open the options chain and note:
Implied Volatility (IV Mid): Example 71.5% → input as 0.715.
Delta for desired strikes:
Aggressive: 0.30 Delta → Closest strike ~ $455.
Moderate: 0.15 Delta → Mid-range strike ~ $470.
Low Delta: 0.05 Delta → Farther strike ~ $505.
Open the indicator and adjust:
IV Mid: Enter 0.715.
Aggressive Delta: Leave at 0.12 (or adjust to bring strikes closer).
Moderate Delta: Leave at 0.18.
Low Delta: Adjust to 0.25 for safer, farther strikes.
View the chart:
Compare the indicator's strikes (red, blue, green) with actual options chain strikes.
Use the visualization to: Validate the risk/reward for each strike.
Align strikes with technical trends, support/resistance.
Adjusting Inputs Based on Risk Tolerance
Higher Risk: Increase Aggressive Delta (e.g., 0.15) for closer strikes.
Use higher IV values for volatile stocks.
Moderate Risk: Use default values (0.12–0.18 Delta).
Balance premiums and probability.
Lower Risk: Increase Low Delta (e.g., 0.30) for farther, safer strikes.
Focus on higher IV stocks with good open interest.
Key Benefits
Simplifies Strike Selection: Visualizes the three risk levels directly on the chart.
Aligns with Market Sentiment: Incorporates IV for realistic forecasts.
Customizable for Risk: Adjust inputs to match personal risk tolerance.
By combining the options chain (IV, Delta, and liquidity) with the technical chart, you get a powerful, visually intuitive tool for covered call strategies.
WhalenatorThis custom TradingView indicator combines multiple analytic techniques to help identify potential market trends, areas of support and resistance, and zones of heightened trading activity. It incorporates a SuperTrend-like line based on ATR, Keltner Channels for volatility-based price envelopes, and dynamic order blocks derived from significant volume and pivot points. Additionally, it highlights “whale” activities—periods of exceptionally large volume—along with an estimated volume profile level and approximate bid/ask volume distribution. Together, these features aim to offer traders a more comprehensive view of price structure, volatility, and institutional participation.
This custom TradingView indicator integrates multiple trading concepts into a single, visually descriptive tool. Its primary goal is to help traders identify directional bias, volatility levels, significant volume events, and potential support/resistance zones on a price chart. Below are the main components and their functionalities:
SuperTrend-Like Line (Trend Bias):
At the core of the indicator is a trend-following line inspired by the SuperTrend concept, which uses Average True Range (ATR) to adaptively set trailing stop levels. By comparing price to these levels, the line attempts to indicate when the market is in an uptrend (price above the line) or a downtrend (price below the line). The shifting levels can provide a dynamic sense of direction and help traders stay with the predominant trend until it shifts.
Keltner Channels (Volatility and Range):
Keltner Channels, based on an exponential moving average and Average True Range, form volatility-based envelopes around price. They help traders visualize whether price is extended (touching or moving outside the upper/lower band) or trading within a stable range. This can be useful in identifying low-volatility consolidations and high-volatility breakouts.
Dynamic Order Blocks (Approximations of Supply/Demand Zones):
By detecting pivot highs and lows under conditions of significant volume, the indicator approximates "order blocks." Order blocks are areas where institutional buying or selling may have occurred, potentially acting as future support or resistance zones. Although these approximations are not perfect, they offer a visual cue to areas on the chart where price might react strongly if revisited.
Volume Profile Proxy and Whale Detection:
The indicator highlights price levels associated with recent maximum volume activity, providing a rough "volume profile" reference. Such levels often become key points of price interaction.
"Whale" detection logic attempts to identify bars where exceptionally large volume occurs (beyond a defined threshold). By tracking these "whale bars," traders can infer where heavy participation—often from large traders or institutions—may influence market direction or create zones of interest.
Approximate Bid/Ask Volume and Dollar Volume Tracking:
The script estimates whether volume within each bar leans more towards the bid or the ask side, aiming to understand which participant (buyers or sellers) might have been more aggressive. Additionally, it calculates dollar volume (close price multiplied by volume) and provides an average to gauge the relative participation strength over time.
Labeling and Visual Aids:
Dynamic labels display Whale Frequency (the ratio of bars with exceptionally large volume), average dollar volume, and approximate ask/bid volume metrics. This gives traders at-a-glance insights into current market conditions, participation, and sentiment.
Strengths:
Multifaceted Analysis:
By combining trend, volatility, volume, and order block logic in one place, the indicator saves chart space and simplifies the analytical process. Traders gain a holistic view without flipping between multiple separate tools.
Adaptable to Market Conditions:
The use of ATR and Keltner Channels adapts to changing volatility conditions. The SuperTrend-like line helps keep traders aligned with the prevailing trend, avoiding constant whipsaws in choppy markets.
Volume-Based Insights:
Integrating whale detection and a crude volume profile proxy helps traders understand where large players might be interacting. This perspective can highlight critical levels that might not be evident from price action alone.
Convenient Visual Cues and Labels:
The indicator provides quick reference points and textual information about the underlying volume dynamics, making decision-making potentially faster and more informed.
Weaknesses:
Heuristic and Approximate Nature:
Many of the indicator’s features, like the "order blocks," "whale detection," and the approximate bid/ask volume, rely on heuristics and assumptions that may not always be accurate. Without actual Level II data or true volume profiles, the insights are best considered as supplementary, not definitive signals.
Lagging Components:
Indicators that rely on past data, like ATR-based trends or moving averages for Keltner Channels, inherently lag behind price. This can cause delayed signals, particularly in fast-moving markets, potentially missing some early opportunities or late in confirming market reversals.
No Guaranteed Predictive Power:
As with any technical tool, it does not forecast the future with certainty. Strong volume at a certain level or a bullish SuperTrend reading does not guarantee price will continue in that direction. Market conditions can change unexpectedly, and false signals will occur.
Complexity and Overreliance Risk:
With multiple signals combined, there’s a risk of information overload. Traders might feel compelled to rely too heavily on this one tool. Without complementary analysis (fundamentals, news, or additional technical confirmation), overreliance on the indicator could lead to misguided trades.
Conclusion:
This integrated indicator offers a comprehensive visual guide to market structure, volatility, and activity. Its strength lies in providing a multi-dimensional viewpoint in a single tool. However, traders should remain aware of its approximations, inherent lags, and the potential for conflicting signals. Sound risk management, position sizing, and the use of complementary analysis methods remain essential for trading success.
Risks Associated with Trading:
No indicator can guarantee profitable trades or accurately predict future price movements. Market conditions are inherently unpredictable, and reliance on any single tool or combination of tools carries the risk of financial loss. Traders should practice sound risk management, including the use of stop losses and position sizing, and should not trade with funds they cannot afford to lose. Ultimately, decisions should be guided by a thorough trading plan and possibly supplemented with other forms of market analysis or professional advice.
Risks and Important Considerations:
• Not a Standalone Tool:
• This indicator should not be used in isolation. It is essential to incorporate additional technical analysis tools, fundamental analysis, and market context when making trading decisions.
• Relying solely on this indicator may lead to incomplete assessments of market conditions.
• Market Volatility and False Signals:
• Financial markets can be highly volatile, and indicators based on historical data may not accurately predict future movements.
• The indicator may produce false signals due to sudden market changes, low liquidity, or atypical trading activity.
• Risk Management:
• Always employ robust risk management strategies, including setting stop-loss orders, diversifying your portfolio, and not over-leveraging positions.
• Understand that no indicator guarantees success, and losses are a natural part of trading.
• Emotional Discipline:
• Avoid making impulsive decisions based on indicator signals alone.
• Emotional trading can lead to significant financial losses; maintain discipline and adhere to a well-thought-out trading plan.
• Continuous Learning and Adaptation:
• Stay informed about market news, economic indicators, and global events that may impact trading conditions.
• Continuously evaluate and adjust your trading strategies as market dynamics evolve.
• Consultation with Professionals:
• Consider seeking advice from financial advisors or professional traders to understand better how this indicator can fit into your overall trading strategy.
• Professional guidance can provide personalized insights based on your financial goals and risk tolerance.
Disclaimer:
Trading financial instruments involves substantial risk and may not be suitable for all investors. Past performance is not indicative of future results. This indicator is provided for informational and educational purposes only and should not be considered investment advice. Always conduct your own research and consult with a licensed financial professional before making any trading decisions.
Note: The effectiveness of any technical indicator can vary based on market conditions and individual trading styles. It's crucial to test indicators thoroughly using historical data and possibly paper trading before applying them in live trading scenarios.

Zigzag3 -Invincible3Description:
Zigzag3 - Invincible3 is a powerful and flexible support and resistance indicator for TradingView. Utilizing an enhanced ZigZag algorithm and Dow Theory principles, it detects price pivots, higher highs (HH), lower highs (LH), higher lows (HL), and lower lows (LL). The indicator draws lines and labels to visualize these pivots, making it easier to identify market structure, trends, and potential reversal points.
The Length input allows traders to control the sensitivity of pivot detection.
Support and Resistance Lines:
Displays dotted and solid SR lines based on significant pivots to highlight key market zones.
Option to extend support/resistance lines dynamically with real-time progression for the latest pivot.
Labels for Dow Theory Points:
Mark higher highs, lower highs, higher lows, and lower lows with customizable colors.
Identifies market direction and potential breakout levels with visual clarity.
ZigZag Line Visualization:
Toggle the ZigZag lines to connect pivots for a better understanding of price movement.
Dynamic Dotted Line Progression:
A dotted line extends in real-time from the most recent significant pivot point, aiding in quick analysis.
This indicator is ideal for traders looking to analyze market structure, identify trends, and spot potential reversals. It can be used as a standalone tool or in combination with other strategies for enhanced precision.

OA S/R PowerPurpose of the Script
This script identifies the strength of support and resistance levels based on key factors like volume, bounce frequency, and retests. Each level is assigned a score (0-100) and visualized with color-coded labels on the chart.
Key Features
Dynamic Strength Calculation:
Volume Strength: Measures the strength based on the volume of candles touching the level.
Bounce Strength: Evaluates how often the price bounces back from the level.
Retest Strength: Scores the consistency of retests over time.
Color-Coded Visualization:
Yellow: Strong levels (Strength ≥ 70).
Orange: Medium levels (Strength between 50-70).
Red: Resistance levels (Price is below the level).
Green: Support levels (Price is above the level).
Fully Customizable Settings:
Adjust the weight for volume, bounce, and retest contributions.
Configure timeframes, percentage range, and number of levels to analyze.
How It Works
Identify Peaks and Valleys: The script calculates local highs and lows using a configurable width setting to determine potential support and resistance levels.
Filter Key Levels: Nearby levels are merged based on a user-defined percentage range, ensuring clean and relevant levels.
Strength Scoring: Levels are scored dynamically based on:
The number of touches.
The volume of touches.
The frequency of bounces and retests.
Visual Feedback: Each level is plotted on the chart with a color-coded label, indicating its importance and price relationship.
Best Use Cases
Quickly identify strong support/resistance zones for breakout or reversal trades.
Use the dynamic scoring system to prioritize key levels for your strategy.
Customize weights to align with your trading style, such as emphasizing volume or retests.

Enhanced London Session SMC SetupEnhanced London Session SMC Setup Indicator
This Pine Script-based indicator is designed for traders focusing on the London trading session, leveraging smart money concepts (SMC) to identify potential trading opportunities in the GBP/USD currency pair. The script uses multiple techniques such as Order Block Detection, Imbalance (Fair Value Gap) Analysis, Change of Character (CHoCH) detection, and Fibonacci retracement levels to aid in market structure analysis, providing a well-rounded approach to trade setups.
Features:
London Session Highlight:
The indicator visually marks the London trading session (from 08:00 AM to 04:00 PM UTC) on the chart using a blue background, signaling when the high-volume, high-impulse moves tend to occur, helping traders focus their analysis on this key session.
Order Block Detection:
Identifies significant impulse moves that may form order blocks (supply and demand zones). Order blocks are areas where institutions have executed large orders, often leading to price reversals or continuation. The indicator plots the high and low of these order blocks, providing key levels to monitor for potential entries.
Imbalance (Fair Value Gap) Detection:
Detects and highlights price imbalances or fair value gaps (FVG) where the market has moved too quickly, creating a gap in price action. These areas are often revisited by price, offering potential trade opportunities. The upper and lower bounds of the imbalance are visually marked for easy reference.
Change of Character (CHoCH) Detection:
This feature identifies potential trend reversals by detecting significant changes in market character. When the price action shifts from bullish to bearish or vice versa, a CHoCH signal is triggered, and the corresponding level is marked on the chart. This can help traders catch trend reversals at key levels.
Fibonacci Retracement Levels:
The script calculates and plots the key Fibonacci retracement levels (0.618 and 0.786 by default) based on the highest and lowest points over a user-defined swing lookback period. These levels are commonly used by traders to identify potential pullback zones where price may reverse or find support/resistance.
Directional Bias Based on Market Structure:
The indicator provides a market structure analysis by comparing the current highs and lows to the previous periods' highs and lows. This helps in identifying whether the market is in a bullish or bearish state, providing a clear directional bias for trade setups.
Alerts:
The indicator comes with built-in alert conditions to notify the trader when an order block, imbalance, CHoCH, or other significant price action event is detected, ensuring timely action can be taken.
Ideal Usage:
Timeframe: Suitable for intraday trading, particularly focusing on the London session (08:00 AM to 04:00 PM UTC).
Currency Pair: Specifically designed for GBP/USD but can be adapted to other pairs with similar market behavior.
Trading Strategy: Best used in conjunction with a price action strategy, focusing on the key levels identified (order blocks, FVG, CHoCH) and using Fibonacci retracement levels for precision entries.
Target Audience: Ideal for traders who follow smart money concepts (SMC) and are looking for a structured approach to identify high-probability setups during the London session.

Globex time (New York Time)This indicator is designed to highlight and analyze price movements within the Globex session. Primarily geared toward the Globex Trap trading strategy, this tool visually identifies the session's high and low prices, allowing traders to better assess price action during extended hours. Here’s a comprehensive breakdown of its features and functionality:
Purpose
The "Globex Time (New York Time)" indicator tracks price levels during the Globex trading session, providing a clear view of overnight market activity. This session, typically running from 6 p.m. ET (18:00) until the following morning at 8:30 a.m. ET, is a critical period where significant market positioning can occur before the regular session opens. In the Globex Trap strategy, the session high and low are essential levels, as price movements around these areas often indicate potential support, resistance, or reversal zones, which traders use to set up entries or exits when the regular trading session begins.
Key Features
Customizable Session Start and End Times
The indicator allows users to specify the exact start and end times of the Globex session in New York time. The default settings are:
Start: 6 p.m. ET (18:00)
End: 8:30 a.m. ET
These settings can be adjusted to align with specific market hours or personal preferences.
Session High and Low Identification
Throughout the defined session, the indicator dynamically calculates and tracks:
Session High: The highest price reached within the session.
Session Low: The lowest price reached within the session.
These levels are essential for the Globex Trap strategy, as price action around them can indicate likely breakout or reversal points when regular trading resumes.
Vertical Lines for Session Start and End
The indicator draws vertical lines at both the session start and end times:
Session Start Line: A solid line marking the exact beginning of the Globex session.
Session End Line: A similar vertical line marking the session’s conclusion.
Both lines are customizable in terms of color and thickness, making it easy to distinguish the session boundaries visually on the chart.
Horizontal Lines for Session High and Low
At the end of the session, the indicator plots horizontal lines representing the Globex session's high and low levels. Users can customize these lines:
Color: Define specific colors for the session high (default: red) and session low (default: green) to easily differentiate them.
Line Style: Options to set the line style (solid, dashed, or dotted) provide flexibility for visual preferences and chart organization.
Automatic Reset for Daily Tracking
To adapt to the next trading day, the indicator resets the session high and low data once the current session ends. This reset prepares it to start tracking new levels at the beginning of the next session without manual intervention.
Practical Application in the Globex Trap Strategy
In the Globex Trap strategy, traders are primarily interested in price behavior around the high and low levels established during the overnight session. Common applications of this indicator for this strategy include:
Breakout Trades: Watching for price to break above the Globex high or below the Globex low, indicating potential momentum in the breakout direction.
Reversal Trades: Monitoring for failed breakouts or traps where price tests and rejects the Globex high or low, suggesting a reversal as liquidity is trapped in these zones.
Support and Resistance Zones: Using the session high and low as key support and resistance levels during the regular trading session, with potential entry or exit points when price approaches these areas.
Additional Configuration Options
Vertical Line Color and Width: Define the color and thickness of the vertical session start and end lines to match your chart’s theme.
Upper and Lower Line Colors and Styles: Customize the appearance of the session high and low horizontal lines by setting color and line style (solid, dashed, or dotted), making it easy to distinguish these critical levels from other chart markings.
Summary
This indicator is a valuable tool for traders implementing the Globex Trap strategy. It visually segments the Globex session and marks essential price levels, helping traders analyze market behavior overnight. Through its customizable options and clear visual representation, it simplifies tracking overnight price activity and identifying strategic levels for potential trade setups during the regular session.

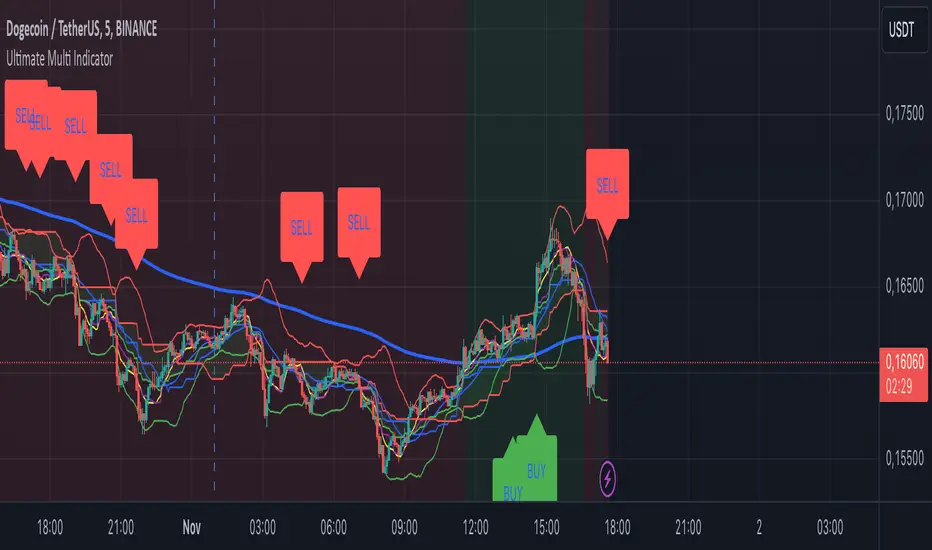
Ultimate Multi Indicator - by SachaThe Ultimate Multi Indicator: The Ultimate Guide To Profit
This custom indicator, the Ultimate Multi Indicator , integrates multiple trading indicators to have powerful buy and sell signals. I combined MACD, EMA, RSI, Bollinger Bands, Volume Profile, and Ichimoku Cloud indicators to help traders analyze both short-term and long-term price movements.
Key Components and How to Use Them
- MACD (Moving Average Convergence Divergence):
- Use for trend direction and potentiality of reversals.
- The blue line (MACD Line) crossing above the orange line (Signal Line) indicates a bullish reversal; the opposite signals a bearish reversal.
- Watch for crossovers to confirm the direction of smaller price movements.
- 200 EMA (Long) (Exponential Moving Average):
- Use to indicate a long-term trend direction.
- If the price is above the 200 EMA, the market is in an uptrend; below it suggests a downtrend.
- The chart’s background color shifts subtly green (uptrend) or red (downtrend) depending on the EMA's relative position.
- RSI (Relative Strength Index):
- Tracks momentum and overbought/oversold levels.
- RSI over 70 signifies overbought conditions; under 30 indicates oversold.
- Look for RSI turning points around these levels to identify potential reversals.
- Bollinger Bands :
- The price touching or crossing the upper Bollinger Band may mean overbought conditions are filled, while a touch at the lower band indicates oversold.
- Bollinger Band interactions often align with key reversal points, especially when combined with other signals.
- Volume Profile :
- A yellow VP line on the chart represents significant trading volume occurred.
- This line can be used as both a support and resistance level, and especially during consolidations or trend changes.
- Ichimoku Cloud :
- Identifies support/resistance levels and trend direction.
- Green and red cloud regions visually show if the price is above (bullish) or below (bearish) key levels.
- Price above the cloud (green) confirms a bullish market, while below (red) signals bearish.
Signal Conditions and Visualization
- Buy Signals :
- This is triggered right away when MACD crosses up, RSI is oversold, or price touches the lower Bollinger Band, provided price is above both the Ichimoku Cloud and the 200 EMA.
- A green “BUY” label appears below the bar, suggesting a potential entry.
- Sell Signals :
- This signal is generated when MACD crosses down, RSI is overbought, or price touches the upper Bollinger Band, and price is below the Ichimoku Cloud and the 200 EMA.
- A red “SELL” label is shown above the bar, indicating a potential exit.
Tips & Tricks
- Confirm Signals : Use multiple signals to confirm entries and exits. For example, if both the MACD and RSI align with the Ichimoku Cloud direction, the trade setup is stronger.
- Trend Directions : Only take buy signals if the price is above the 200 EMA, and sell signals if it is below, aligning trades with the overall trend.
- Adjust for Volatility : In high-volatility markets, especially in the crypto markets, pay close attention to the Bollinger Bands for breakout potential.
- Ichimoku as a Trend Guide : Use the Ichimoku Cloud as a guide for long-term support and resistance levels, especially for swing trades.
This multi-layered indicator gives a balanced blend of short-term signals and long-term trend insights, making it a versatile tool for day trading, swing trading, or even longer-term analysis.
Remember that indicators that will make you rich instantly don't exist. To expect minimum profit from them, you shouldn't trade all you have at the same time but only trade with the money you can afford to lose.
After that being said, I wish you traders luck with the Ultimate Multi Indicator!
Linear Regression Channel UltimateKey Features and Benefits
Logarithmic scale option for improved analysis of long-term trends and volatile markets
Activity-based profiling using either touch count or volume data
Customizable channel width and number of profile fills
Adjustable number of most active levels displayed
Highly configurable visual settings for optimal chart readability
Why Logarithmic Scale Matters
The logarithmic scale option is a game-changer for analyzing assets with exponential growth or high volatility. Unlike linear scales, log scales represent percentage changes consistently across the price range. This allows for:
Better visualization of long-term trends
More accurate comparison of price movements across different price levels
Improved analysis of volatile assets or markets experiencing rapid growth
How It Works
The indicator calculates a linear regression line based on the specified period
Upper and lower channel lines are drawn at a customizable distance from the regression line
The space between the channel lines is divided into a user-defined number of levels
For each level, the indicator tracks either:
- The number of times price touches the level (touch count method)
- The total volume traded when price is at the level (volume method)
The most active levels are highlighted based on this activity data
Understanding Touch Count vs Volume
Touch count method: Useful for identifying key support/resistance levels based on price action alone
Volume method: Provides insight into levels where the most trading activity occurs, potentially indicating stronger support/resistance
Practical Applications
Trend identification and strength assessment
Support and resistance level discovery
Entry and exit point optimization
Volume profile analysis for improved market structure understanding
This Linear Regression Channel indicator combines powerful statistical analysis with flexible visualization options, making it an invaluable tool for traders and analysts across various timeframes and markets. Its unique features, especially the logarithmic scale and activity profiling, provide deeper insights into market behavior and potential turning points.

Alpine Predictive BandsAlpine Predictive Bands - ADX & Trend Projection is an advanced indicator crafted to estimate potential price zones and trend strength by integrating dynamic support/resistance bands, ADX-based confidence scoring, and linear regression-based price projections. Designed for adaptive trend analysis, this tool combines multi-timeframe ADX insights, volume metrics, and trend alignment for improved confidence in trend direction and reliability.
Key Calculations and Components:
Linear Regression for Price Projection:
Purpose: Provides a trend-based projection line to illustrate potential price direction.
Calculation: The Linear Regression Centerline (LRC) is calculated over a user-defined lookbackPeriod. The slope, representing the rate of price movement, is extended forward using predictionLength. This projected path only appears when the confidence score is 70% or higher, revealing a white dotted line to highlight high-confidence trends.
Adaptive Prediction Bands:
Purpose: ATR-based bands offer dynamic support/resistance zones by adjusting to volatility.
Calculation: Bands are calculated using the Average True Range (ATR) over the lookbackPeriod, multiplied by a volatilityMultiplier to adjust the width. These shaded bands expand during higher volatility, guiding traders in identifying flexible support/resistance zones.
Confidence Score (ADX, Volume, and Trend Alignment):
Purpose: Reflects the reliability of trend projections by combining ADX, volume status, and EMA alignment across multiple timeframes.
ADX Component: ADX values from the current timeframe and two higher timeframes assess trend strength on a broader scale. Strong ADX readings across timeframes boost the confidence score.
Volume Component: Volume strength is marked as “High” or “Low” based on a moving average, signaling trend participation.
Trend Alignment: EMA alignment across timeframes indicates “Bullish” or “Bearish” trends, confirming overall trend direction.
Calculation: ADX, volume, and trend alignment integrate to produce a confidence score from 0% to 100%. When the score exceeds 70%, the white projection line is activated, underscoring high-confidence trend continuations.
User Guide
Projection Line: The white dotted line, which appears only when the confidence score is 70% or higher, highlights a high-confidence trend.
Prediction Bands: Adaptive bands provide potential support/resistance zones, expanding with market volatility to help traders visualize price ranges.
Confidence Score: A high score indicates a stronger, more reliable trend and can support trend-following strategies.
Settings
Prediction Length: Determines the forward length of the projection.
Lookback Period: Sets the data range for calculating regression and ATR.
Volatility Multiplier: Adjusts the width of bands to match volatility levels.
Disclaimer: This indicator is for educational purposes and does not guarantee future price outcomes. Additional analysis is recommended, as trading carries inherent risks.

Multi-Average Trend Indicator (MATI)[FibonacciFlux]Multi-Average Trend Indicator (MATI)
Overview
The Multi-Average Trend Indicator (MATI) is a versatile technical analysis tool designed for traders who aim to enhance their market insights and streamline their decision-making processes across various timeframes. By integrating multiple advanced moving averages, this indicator serves as a robust framework for identifying market trends, making it suitable for different trading styles—from scalping to swing trading.
MATI 4-hourly support/resistance
MATI 1-hourly support/resistance
MATI 15 minutes support/resistance
MATI 1 minutes support/resistance
Key Features
1. Diverse Moving Averages
- COVWMA (Coefficient of Variation Weighted Moving Average) :
- Provides insights into price volatility, helping traders identify the strength of trends in fast-moving markets, particularly useful for 1-minute scalping .
- DEMA (Double Exponential Moving Average) :
- Minimizes lag and quickly responds to price changes, making it ideal for capturing short-term price movements during volatile trading sessions .
- EMA (Exponential Moving Average) :
- Focuses on recent price action to indicate the prevailing trend, vital for day traders looking to enter positions based on current momentum.
- KAMA (Kaufman's Adaptive Moving Average) :
- Adapts to market volatility, smoothing out price action and reducing false signals, which is crucial for 4-hour day trading strategies.
- SMA (Simple Moving Average) :
- Provides a foundational view of the market trend, useful for swing traders looking at overall price direction over longer periods.
- VIDYA (Variable Index Dynamic Average) :
- Adjusts based on market conditions, offering a dynamic perspective that can help traders capture emerging trends.
2. Combined Moving Average
- The MATI's combined moving average synthesizes all individual moving averages into a single line, providing a clear and concise summary of market direction. This feature is especially useful for identifying trend continuations or reversals across various timeframes .
3. Dynamic Color Coding
- Each moving average is visually represented with color coding:
- Green indicates bullish conditions, while Red suggests bearish trends.
- This visual feedback allows traders to quickly assess market sentiment, facilitating faster decision-making.
4. Signal Generation and Alerts
- The indicator generates buy signals when the combined moving average crosses above its previous value, indicating a potential upward trend—ideal for quick entries in scalping.
- Conversely, sell signals are triggered when the combined moving average crosses below its previous value, useful for exiting positions or entering short trades.
Insights and Applications
1. Scalping on 1-Minute Charts
- The MATI excels in fast-paced environments, allowing scalpers to identify quick entry and exit points based on short-term trends. With dynamic signals and alerts, traders can react swiftly to price movements, maximizing profit potential in brief price fluctuations.
2. Day Trading on 4-Hour Charts
- For day traders, the MATI provides essential insights into intraday trends. By analyzing the combined moving average and its relation to individual moving averages, traders can make informed decisions on when to enter or exit positions, capitalizing on daily price swings.
3. Swing Trading on Daily Charts
- The MATI also serves as a valuable tool for swing traders. By evaluating longer-term trends through the combined moving average, traders can identify potential swing points and adjust their strategies accordingly. The flexibility of adjusting the lengths of the moving averages allows for tailored approaches based on market volatility.
Benefits
1. Clarity and Insight
- The combination of diverse moving averages offers a clear visual representation of market trends, aiding traders in making informed decisions across multiple timeframes.
2. Flexibility and Customization
- With adjustable parameters, traders can adapt the MATI to their specific strategies, making it suitable for various market conditions and trading styles.
3. Real-Time Alerts and Efficiency
- Built-in alerts minimize response times, allowing traders to capitalize on opportunities as they arise, regardless of their trading style.
Conclusion
The Multi-Average Trend Indicator (MATI) is an essential tool for traders seeking to enhance their technical analysis capabilities. By seamlessly integrating multiple moving averages with dynamic color coding and real-time alerts, this indicator provides a comprehensive approach to understanding market trends. Its versatility makes it an invaluable asset for scalpers, day traders, and swing traders alike.
Important Note
As with any trading tool, thorough analysis and risk management are crucial when using this indicator. Past performance does not guarantee future results, and traders should always be prepared for market fluctuations.

$TUBR: 7-25-99 Moving Average7, 25, and 99 Period Moving Averages
This indicator plots three moving averages: the 7-period, 25-period, and 99-period Simple Moving Averages (SMA). These moving averages are widely used to smooth out price action and help traders identify trends over different time frames. Let's break down the significance of these specific moving averages from both supply and demand perspectives and a price action perspective.
1. Supply and Demand Perspective:
- 7-period Moving Average (Short-Term) :
The 7-period moving average represents the short-term sentiment in the market. It captures the rapid fluctuations in price and is heavily influenced by recent supply and demand changes. Traders often look to the 7-period SMA for immediate price momentum, with price moving above or below this line signaling short-term strength or weakness.
- Bullish Supply/Demand : When price is above the 7-period SMA, it suggests that buyers are currently in control and demand is higher than supply. Conversely, price falling below this line indicates that supply is overpowering demand, leading to a short-term downtrend.
Is current price > average price in past 7 candles (depending on timeframe)? This will tell you how aggressive buyers are in short term.
- Key Supply/Demand Zones : The 7-period SMA often acts as dynamic support or resistance in a trending market, where traders might use it to enter or exit positions based on how price interacts with this level.
- 25-period Moving Average (Medium-Term) :
The 25-period SMA smooths out more of the noise compared to the 7-period, providing a more stable indication of intermediate trends. This moving average is often used to gauge the market's supply and demand balance over a broader timeframe than the short-term 7-period SMA.
- Supply/Demand Balance : The 25-period SMA reflects the medium-term equilibrium between supply and demand. A crossover between the price and the 25-period SMA may indicate a shift in this balance. When price sustains above the 25-period SMA, it shows that demand is strong enough to maintain an upward trend. Conversely, if the price stays below it, supply is likely exceeding demand.
Is current price > average price in past 25 candles (depending on timeframe)? This will tell you how aggressive buyers are in mid term.
- Momentum Shift : Crossovers between the 7-period and 25-period SMAs can indicate momentum shifts between short-term and medium-term demand. For example, if the 7-period crosses above the 25-period, it often signifies growing short-term demand relative to the medium-term trend, signaling potential buy opportunities. What this crossover means is that if 7MA > 25MA that means in past 7 candles average price is more than past 25 candles.
- 99-period Moving Average (Long-Term):
The 99-period SMA represents the long-term trend and reflects the market's supply and demand over an extended period. This moving average filters out short-term fluctuations and highlights the market's overall trajectory.
- Long-Term Supply/Demand Dynamics : The 99-period SMA is slower to react to changes in supply and demand, providing a more stable view of the market's overall trend. Price staying above this line shows sustained demand dominance, while price consistently staying below reflects ongoing supply pressure.
Is current price > average price in past 99 candles (depending on timeframe)? This will tell you how aggressive buyers are in long term.
- Market Trend Confirmation : When both the 7-period and 25-period SMAs are above the 99-period SMA, it signals a strong bullish trend with demand outweighing supply across all timeframes. If all three SMAs are below the 99-period SMA, it points to a bear market where supply is overpowering demand in both the short and long term.
2. Price Action Perspective :
- 7-period Moving Average (Short-Term Trends):
The 7-period moving average closely tracks price action, making it highly responsive to quick shifts in price. Traders often use it to confirm short-term reversals or continuations in price action. In an uptrend, price typically stays above the 7-period SMA, whereas in a downtrend, price stays below it.
- Short-Term Price Reversals : Crossovers between the price and the 7-period SMA often indicate short-term reversals. When price breaks above the 7-period SMA after staying below it, it suggests a potential bullish reversal. Conversely, a price breakdown below the 7-period SMA could signal a bearish reversal.
- 25-period Moving Average (Medium-Term Trends) :
The 25-period SMA helps identify the medium-term price action trend. It balances short-term volatility and longer-term stability, providing insight into the more persistent trend. Price pullbacks to the 25-period SMA during an uptrend can act as a buying opportunity for trend traders, while pullbacks during a downtrend may offer shorting opportunities.
- Pullback and Continuation: In trending markets, price often retraces to the 25-period SMA before continuing in the direction of the trend. For instance, if the price is in a bullish trend, traders may look for support at the 25-period SMA for potential continuation trades.
- 99-period Moving Average (Long-Term Trend and Market Sentiment ):
The 99-period SMA is the most critical for identifying the overall market trend. Price consistently trading above the 99-period SMA indicates long-term bullish momentum, while price staying below the 99-period SMA suggests bearish sentiment.
- Trend Confirmation : Price action above the 99-period SMA confirms long-term upward momentum, while price action below it confirms a downtrend. The space between the shorter moving averages (7 and 25) and the 99-period SMA gives a sense of the strength or weakness of the trend. Larger gaps between the 7 and 99 SMAs suggest strong bullish momentum, while close proximity indicates consolidation or potential reversals.
- Price Action in Trending Markets : Traders often use the 99-period SMA as a dynamic support/resistance level. In strong trends, price tends to stay on one side of the 99-period SMA for extended periods, with breaks above or below signaling major changes in market sentiment.
Why These Numbers Matter:
7-Period MA : The 7-period moving average is a popular choice among short-term traders who want to capture quick momentum changes. It helps visualize immediate market sentiment and is often used in conjunction with price action to time entries or exits.
- 25-Period MA: The 25-period MA is a key indicator for swing traders. It balances sensitivity and stability, providing a clearer picture of the intermediate trend. It helps traders stay in trades longer by filtering out short-term noise, while still being reactive enough to detect reversals.
- 99-Period MA : The 99-period moving average provides a broad view of the market's direction, filtering out much of the short- and medium-term noise. It is crucial for identifying long-term trends and assessing whether the market is bullish or bearish overall. It acts as a key reference point for longer-term trend followers, helping them stay with the broader market sentiment.
Conclusion:
From a supply and demand perspective, the 7, 25, and 99-period moving averages help traders visualize shifts in the balance between buyers and sellers over different time horizons. The price action interaction with these moving averages provides valuable insight into short-term momentum, intermediate trends, and long-term market sentiment. Using these three MAs together gives a more comprehensive understanding of market conditions, helping traders align their strategies with prevailing trends across various timeframes.
------------- RULE BASED SYSTEM ---------------
Overview of the Rule-Based System:
This system will use the following moving averages:
7-period MA: Represents short-term price action.
25-period MA: Represents medium-term price action.
99-period MA: Represents long-term price action.
1. Trend Identification Rules:
Bullish Trend:
The 7-period MA is above the 25-period MA, and the 25-period MA is above the 99-period MA.
This structure shows that short, medium, and long-term trends are aligned in an upward direction, indicating strong bullish momentum.
Bearish Trend:
The 7-period MA is below the 25-period MA, and the 25-period MA is below the 99-period MA.
This suggests that the market is in a downtrend, with bearish momentum dominating across timeframes.
Neutral/Consolidation:
The 7-period MA and 25-period MA are flat or crossing frequently with the 99-period MA, and they are close to each other.
This indicates a sideways or consolidating market where there’s no strong trend direction.
2. Entry Rules:
Bullish Entry (Buy Signals):
Primary Buy Signal:
The price crosses above the 7-period MA, AND the 7-period MA is above the 25-period MA, AND the 25-period MA is above the 99-period MA.
This indicates the start of a new upward trend, with alignment across the short, medium, and long-term trends.
Pullback Buy Signal (for trend continuation):
The price pulls back to the 25-period MA, and the 7-period MA remains above the 25-period MA.
This indica
tes that the pullback is a temporary correction in an uptrend, and buyers may re-enter the market as price approaches the 25-period MA.
You can further confirm the signal by waiting for price action (e.g., bullish candlestick patterns) at the 25-period MA level.
Breakout Buy Signal:
The price crosses above the 99-period MA, and the 7-period and 25-period MAs are also both above the 99-period MA.
This confirms a strong bullish breakout after consolidation or a long-term downtrend.
Bearish Entry (Sell Signals):
Primary Sell Signal:
The price crosses below the 7-period MA, AND the 7-period MA is below the 25-period MA, AND the 25-period MA is below the 99-period MA.
This indicates the start of a new downtrend with alignment across the short, medium, and long-term trends.
Pullback Sell Signal (for trend continuation):
The price pulls back to the 25-period MA, and the 7-period MA remains below the 25-period MA.
This indicates that the pullback is a temporary retracement in a downtrend, providing an opportunity to sell as price meets resistance at the 25-period MA.
Breakdown Sell Signal:
The price breaks below the 99-period MA, and the 7-period and 25-period MAs are also below the 99-period MA.
This confirms a strong bearish breakdown after consolidation or a long-term uptrend reversal.
3. Exit Rules:
Bullish Exit (for long positions):
Short-Term Exit:
The price closes below the 7-period MA, and the 7-period MA starts crossing below the 25-period MA.
This indicates weakening momentum in the uptrend, suggesting an exit from the long position.
Stop-Loss Trigger:
The price falls below the 99-period MA, signaling the breakdown of the long-term trend.
This can act as a final exit signal to minimize losses if the long-term uptrend is invalidated.
Bearish Exit (for short positions):
Short-Term Exit:
The price closes above the 7-period MA, and the 7-period MA starts crossing above the 25-period MA.
This indicates a potential weakening of the downtrend and signals an exit from the short position.
Stop-Loss Trigger:
The price breaks above the 99-period MA, invalidating the bearish trend.
This signals that the market may be reversing to the upside, and exiting short positions would be prudent.

Supply and demandHi all!
This is my take on supply/demand. The gist is that it creates a zone if there is a big enough reaction. This is configurable in settings as "Minimum range (ATR factor)" (the Average True Length of length 14) that is the distance that the price must travel and "Reaction bars" that is the maximum number of bars that price must travel this distance. The zones that are shown are the ones that have a retest, break and retest or is unmitigated (untouched). If a zone is mitigated (entered) or broken it is temporarily hidden. For a zone to be created it needs to have this reaction and the previous bar does not.
So this script will show you zones that are fresh (unmitigated), retested or broken and retested. This means that the zones that are shown have "proven" that they are good zones through this. Basically it means that the script creates a bunch of zones and then picks the good once. This makes the script have some latency, but will hopefully give you good zones. A zone is completely removed if it's broken twice (it's okay if it's broken once and can still have a retest after it has flipped from previous supply (or resistance) into demand (or support)).
Here is a zone (the one that has the lowest opacity) that is broken and retested that could have resulted in a good long trade (the settings are default but has a stop in the beginning of 2024):
You have a setting to remove zones that are pierced (broken by price wicks). The following zone is pierced by price (in the beginning of May) that will not be shown after the start of May if you have "Pierced" checked (the indicator has default settings but a stop in the middle of April):
You have a trend section. Zones that create a reaction upwards can only be created if the trend is considered to be up, and vice versa. The options here are "SMA50" (the current price needs to be over the Simple Moving Average of length 50) and "SMA50, SMA200" (price needs to be over the Simple Moving Average of length 50 and the Simple Moving Average of length 50 needs to be over the Simple Moving Average of length 200). If these conditions are met the trend is considered to be up, otherwise it's down. You can disable this by choosing "No detection".
The zones that are shown also need to be within a limit (of the current price). This limit is 10 (factor of the Average True Range if length 14) by default. Set this to 0 to deactivate. This is useful for not showing zones that are far away from current price and therefore unlikely to be interacted with.
You can stop the calculation of zones (through the "Stop" value in the settings). This is useful to see if previous zones were any good. I used it in my testing of the script but left it because it can be nice to have.
The zones created by the script have different transparency based upon the zone's interaction. The clearest zones are the ones that are unmitigated, the second clearest ones are the ones having a retest and lastly the zones which are most unclear are the ones having a break and then a retest.
You can see the concept of this script to be a mix of supply/demand and support/resistance, having zones being unmitigated (untouched) as the most important but also show the zones having an interaction (in the form of a retest or a break and retest).
This is from a previous supply (or resistance) zone that has flipped into demand (or support) and has shown to be a good zone through a retest followed by a rally (default settings):
This zone has multiple retest and then rallies that could have given a good long trades (it has the default settings but a "Stop" time at 2022-01-14):
TODO:
- Create zones based on pivots
- Handle overlapping zones
- Incorporate volume in the creation and/or interaction with zones
- Add alerts
- Add ability to set maximum zone width
- Add ability to set the maximum number of retest bars
- ...?
The example for this publication has the default settings bit a "Stop" and a tighter "Limit" of 4.
I hope this explanation makes sense, let me know otherwise. Also let me know if you have any suggestions on improvements.
Best of trading luck!
